

Server-Sent Events in C# + React: Watch 5,000 Devices Die
Server-Sent Events in C# + React: Watch 5,000 Devices Die
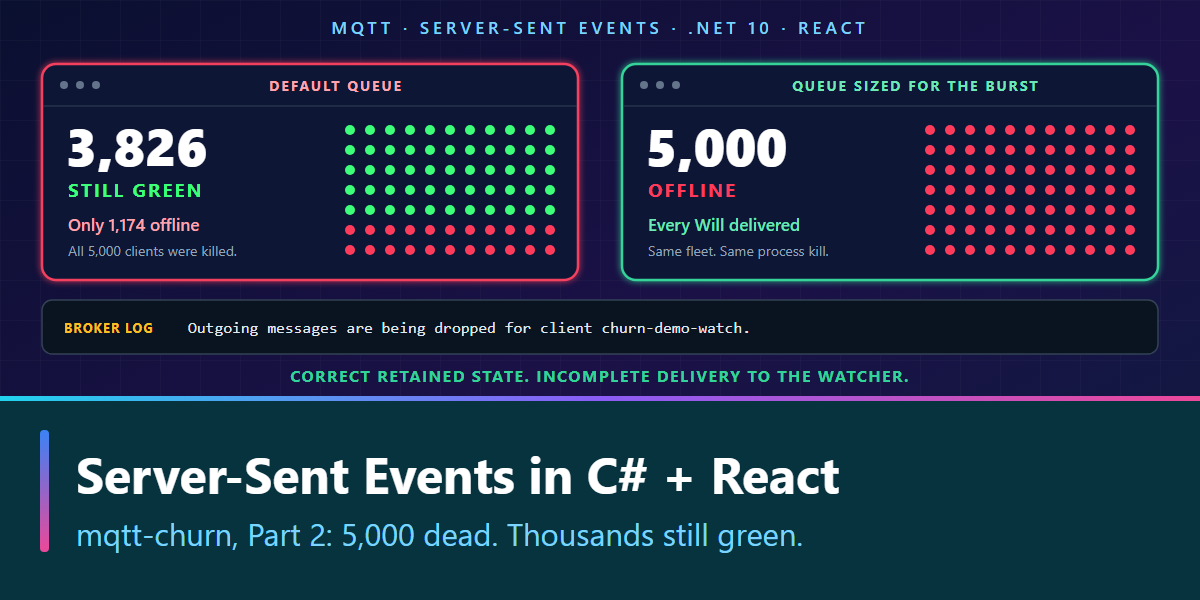
mqtt-churn series, part 2. Video: Server-Sent Events in C# + React · Code:
mqtt-churnat tagb2· Previous: Simulate 1000 MQTT Clients in C#.
I killed 5,000 MQTT clients at once. The dashboard turned 1,174 of them red, then stopped. The other 3,826 stayed green, even though every client process was gone.
The browser was showing exactly what its backend knew. That was the problem.
In part 1, we built a fleet of real MQTTnet clients, each with a retained online status and a retained offline Last Will. This time we build the observer: an ASP.NET Core subscriber, a Server-Sent Events endpoint, and a React heatmap. Then we kill the fleet and follow the missing updates back to the broker.
Watch the walkthrough, including the failed run and the fix:
Table of Contents
- Why Server-Sent Events?
- Keep the observer next to the broker
- The watcher is another MQTT subscriber
- One character per device
- Stream snapshots from C#
- Receive frames in React
- Draw the fleet on one canvas
- Kill the fleet, then check the broker log
- Raise the queue limit and repeat
- Clean exit is a different state
- Run the demo
- What this dashboard cannot prove
- Key takeaways
Why Server-Sent Events?
The browser needs the fleet's state. It doesn't send commands back.
| Option | What it means for this dashboard |
|---|---|
| MQTT over WebSockets | Each browser tab becomes another MQTT subscriber, with its own broker connection and outgoing delivery queue. |
| SignalR | Useful when you need its hubs, groups, client calls or other connection features. This display doesn't need those features. |
| Server-Sent Events | A long-lived HTTP response from server to browser. The browser already has EventSource, and .NET 10 provides a typed response. |
SignalR can use SSE as a transport too. The choice here is about how much application machinery this one-way display needs.
SSE fits without adding a streaming library on either side. It is an existing web standard; the .NET 10 addition is TypedResults.ServerSentEvents, not SSE itself.
Keep the observer next to the broker
Part 1 caught Podman's Windows port forwarder adding latency and limiting how many clients connected. Keep that lesson:
- The broker, fleet and watcher run inside the same container network.
- The watcher is a separate process, so killing the fleet cannot kill the observer.
- The browser sits outside the network and only draws what the watcher sends.
An HTTP connection through the published dashboard port is fine for watching. It isn't where we will measure precise Last Will latency.
The watcher is another MQTT subscriber
Each device publishes on a topic such as churn/demo/42/status. The watcher subscribes once, using the single-level wildcard:
await mqtt.SubscribeAsync(
    $"churn/{runId}/+/status",
    MqttQualityOfServiceLevel.AtLeastOnce);
The status messages are retained. The broker delivers the stored statuses when the watcher subscribes, then forwards subsequent changes. Both go through the same handler:
mqtt.ApplicationMessageReceivedAsync += e =>
{
    grid.Apply(
        e.ApplicationMessage.Topic,
        e.ApplicationMessage.ConvertPayloadToString());
    return Task.CompletedTask;
};
Register that handler before connecting and subscribing. The complete setup is in Program.cs at tag b2.
The watcher connects with a recognizable client ID: churn-demo-watch. That name matters when we get to the broker log. It also has a consequence: starting a second watcher with the same run ID takes over the same MQTT client ID and disconnects the first. Browser tabs don't do this; they share the watcher through HTTP.
One character per device
The watcher stores one character for each device index:
| Character | Meaning in this demo | Display |
|---|---|---|
. |
No status received yet | Dark |
o |
Received online |
Green |
x |
Received offline, normally the Last Will |
Red |
- |
Received an empty payload, used for a clean exit | Grey |
The payload mapping in Grid.cs is small:
public static char? State(string? payload) => payload switch
{
    "online" => 'o',
    "offline" => 'x',
    null or "" => '-',
    _ => null,
};
Apply ignores unrecognized payloads and device indices outside the grid. A snapshot contains a sequence number, the three counts, and a string holding all the cells:
sealed record Frame(
    long Seq,
    int Online,
    int Offline,
    int Gone,
    string Cells);
These are observed statuses, not an independent check of whether the devices are alive. Green means the last message received for that device said online.
Stream snapshots from C#
The grid exposes an asynchronous stream. It yields the current snapshot immediately, then samples on a 100 ms timer:
public async IAsyncEnumerable<Frame> Frames(
    [EnumeratorCancellation] CancellationToken ct)
{
    using var timer = new PeriodicTimer(TimeSpan.FromMilliseconds(100));
    for (long seq = 1; !ct.IsCancellationRequested; seq++)
    {
        yield return Snapshot(seq);
        await timer.WaitForNextTickAsync(ct);
    }
}
EnumeratorCancellation comes from System.Runtime.CompilerServices. The endpoint passes request cancellation into that iterator:
app.MapGet("/frames", (CancellationToken ct) =>
    TypedResults.ServerSentEvents(grid.Frames(ct), eventType: "frame"));
ASP.NET Core handles the SSE response format. The response has content type text/event-stream; each message has an event: frame line, a data: line containing the JSON, and a blank line separating it from the next message.
You can inspect it without React:
curl.exe -N http://localhost:5080/frames
Every message carries the full snapshot. A browser that arrives late doesn't need a replay log. If its HTTP connection drops and EventSource reconnects, it can replace its view with the next snapshot.
That only recovers the watcher's current state. If the watcher missed an MQTT message upstream, sending its snapshot again doesn't repair the missing information.
At 5,000 devices, the recorded frames were 5,053 to 5,055 bytes of JSON. Ten frames per second is roughly 50 KB/s per open tab, before protocol overhead. That's the cost of avoiding delta tracking and replay in this demo.
Receive frames in React
The frontend hook opens one EventSource, listens for the named frame event, and closes the connection in its cleanup. This is the hook from useFrames.ts:
import { useEffect, useState } from 'react'

export type Frame = {
  seq: number
  online: number
  offline: number
  gone: number
  cells: string
}

export function useFrames(url = '/frames') {
  const [frame, setFrame] = useState<Frame>()
  const [live, setLive] = useState(false)

  useEffect(() => {
    const source = new EventSource(url)
    source.onopen = () => setLive(true)
    source.onerror = () => setLive(false)
    source.addEventListener('frame', (e) => setFrame(JSON.parse(e.data)))
    return () => source.close()
  }, [url])

  return { frame, live }
}
The browser handles HTTP reconnection. There is no custom retry loop here.
The cleanup is important in ordinary navigation and in React development. With Strict Mode enabled, React runs an extra setup-and-cleanup cycle to check that the effect can be repeated safely. Opening a connection without closing it leaks a stream. See React's useEffect documentation.
Also, live here only means the browser's SSE connection is open. It doesn't prove that the watcher's MQTT connection is healthy.
The production UI is served by the watcher, so the page and /frames share an origin. During development, Vite proxies /frames to the watcher.
Draw the fleet on one canvas
Heatmap.tsx draws one dot per character on a single canvas. Whenever cells changes, it clears the canvas, loops through the string, chooses the color and draws each dot at its row and column.
React manages one canvas element rather than 5,000 individual DOM elements. That's a description of the implementation, not a measured claim that a DOM-based version could never keep up.
The page also shows the online, offline and gone counts as text, so the colors aren't the only way to read the result.
Kill the fleet, then check the broker log
Wait until the watcher shows 5,000 online, then kill the fleet container:
podman kill churn-fleet
This isn't a polite MQTT disconnect. The processes stop, their sockets close, and the broker publishes their Wills.
In the recorded video, the grid stopped at 1,174 offline and 3,826 online. The first suspicion was the display. But a raw read of /frames showed the same counts as the browser.
The broker log explained the discrepancy:
Outgoing messages are being dropped for client churn-demo-watch.
At the tested defaults, Mosquitto allows up to 20 QoS 1/2 messages in flight per client and 1,000 more queued. Our one watcher receives every device's status. A burst of 5,000 Wills can fill that subscriber's outgoing queue faster than it drains, and messages beyond the limit are dropped.
The number delivered isn't a fixed 1,020: acknowledgements let messages leave the queue while the burst is arriving. That's why separate runs delivered different counts.
The retained offline messages on the broker were correct. Delivery to this watcher was incomplete. Retention stores the latest message per topic; it doesn't remove the subscriber's delivery limits. Even a fresh watcher loading the retained messages hit the default queue limit.
QoS 1 isn't a promise of unlimited buffering. Check the broker's queue limits as well as the QoS selected by your publishers and subscribers.
Raise the queue limit and repeat
For the demo, I set this in mosquitto\mosquitto.conf:
max_queued_messages 100000
That is deliberately roomy for the 5,000-device burst, not a universal production setting. Queued messages consume memory; payload size, subscriber count, drain rate and other configured limits matter too.
After restarting the broker and watcher, I connected a fresh fleet and repeated the kill. The watcher saw all 5,000 Wills.
These are the recorded runs on my machine: Mosquitto 2.1.2 in Podman 5.8 on Windows 11, MQTTnet 5.2, .NET 10. The fleet connected at 500 clients per second, with both fleet and watcher inside the compose network.
| What the watcher saw | Default queue, three runs | max_queued_messages 100000 |
|---|---|---|
| Clean exit: 5,000 retained statuses cleared | 2,726 / 2,594 / 1,808 gone | All 5,000 gone |
| Process kill: 5,000 Wills | 1,280 / 1,344 / 1,291 offline | All 5,000 offline |
Fresh watcher loading 5,000 retained offline messages |
1,040 each time | All 5,000 in its first frame |
The video's 1,174-offline result is a separate capture, not one of those three default-queue runs. Across the runs and captures, roughly three quarters of the killed fleet stayed green at the defaults.
In the fixed run, the first red cells appeared in the frame 696 ms after the kill command, and the frame at 895 ms showed all 5,000 offline. That's about 200 ms from the first observed red cells to the full red grid, not 200 ms from the kill command.
These observations have 100 ms sampling resolution and include the command-to-observation path. They aren't per-device Will latency percentiles. The raw output is in runs/b2-output.txt.
Clean exit is a different state
On a normal exit, each fleet client publishes an empty retained payload to clear its status topic, then sends a normal MQTT DISCONNECT. No Will fires.
The already-subscribed watcher sees that empty payload and turns the cell grey. A crash produces an offline Will and turns it red.
There's a subtle distinction: clearing a retained message removes it. A watcher that subscribes after the clean exit doesn't receive a stored "gone" message; it has never seen that device and leaves its cell dark. Grey records a clear that this watcher actually observed.
The default queue lost some of those clears too, as the table shows. Testing only abrupt failures would have missed the same delivery problem on the clean-exit path.
Run the demo
You need Git, the .NET 10 SDK and Podman with Compose support. The repository's multi-stage container build builds the React UI, so running this setup doesn't require Node on the host.
From PowerShell:
git clone https://github.com/Romain-OD/mqtt-churn.git
Set-Location .\mqtt-churn
git switch --detach b2
podman compose up -d --build

dotnet publish .\src\MqttChurn -c Release -r linux-x64 `
  --self-contained false -o .\out\fleet

podman run -d --name churn-fleet --network mqtt-churn_default `
  -v "${PWD}\out\fleet:/app" -w /app `
  mcr.microsoft.com/dotnet/aspnet:10.0 dotnet MqttChurn.dll `
  --broker mosquitto --clients 5000 --rate 500 --hold 600 --run-id demo
Open http://localhost:5080 and wait for 5,000 online before running the kill command. The watcher in compose.yaml uses run ID demo and 5,000 cells; the fleet must match that run ID.
To inspect dropped-message warnings:
podman compose logs mosquitto | Select-String 'dropped'
The checked-in configuration already has the larger queue. To reproduce the failed run, comment out max_queued_messages 100000 in mosquitto\mosquitto.conf, restart the stack, then start a fresh fleet. Restore the setting before testing the fixed case.
Between cases, remove the stopped fleet container and recreate the stack:
podman rm churn-fleet
podman compose down
podman compose up -d --build
Stop or kill a still-running fleet before removing it. This demo doesn't persist the broker's retained messages, so recreating the broker resets the retained state as well as the watcher. Simply restarting the watcher can reload the previous run's retained colors.
For the clean-exit case, use a short --hold, such as 4, instead of 600 and let the fleet finish without killing it. Keep the watcher connected to observe the clears.
What this dashboard cannot prove
An open status topic can be forged. On this demo's anonymous broker, the following publish turns device 42 red even while its client is connected:
podman compose exec mosquitto mosquitto_pub -q 1 -r `
  -t churn/demo/42/status -m offline
The grid reads a message, not the broker's connection table. Authenticate clients and restrict which identities can publish each device's status topic before trusting that input.
Browser recovery isn't broker recovery. At tag b2, the watcher doesn't reconnect to MQTT after a broker restart. Its HTTP endpoint can keep streaming stale state. A production display needs to expose upstream connection health and treat disconnected or stale observations as unknown.
Snapshots trade bandwidth for simpler recovery. About 50 KB/s per tab is workable for this demo. Don't extrapolate the same full-grid design to a million devices without measuring; deltas or a narrower view may become necessary.
HTTP/1.1 limits concurrent browser connections. In the Chromium test, six tabs streamed and the seventh waited for /frames. Browsers commonly impose a six-connection-per-domain limit under HTTP/1.1. HTTP/2 multiplexes streams and avoids that particular ceiling, subject to negotiated stream limits.
The grid is an observation tool, not a latency instrument. It samples every 100 ms and can miss intermediate transitions. The next part measures Will arrival using timestamps inside the network.
Key takeaways
- Use SSE when a browser only needs server-to-client updates; .NET 10 and
EventSourcecover this display without another streaming library. - Full snapshots simplify late joins and HTTP reconnection, but only reproduce what the watcher knows.
- Close
EventSourcein the React effect cleanup. - Test subscriber delivery during bursts. Correct retained state doesn't mean every observer received every update.
- Distinguish clean clears,
offlinemessages and states never observed. Don't treat green as proof of liveness.
Next, part 3: a process kill closed the sockets, so the broker could notice immediately. Cutting the network sends no clean goodbye and no socket close to the broker. How long does the grid stay green before keep-alive detection fires the Wills?